12/17/2009

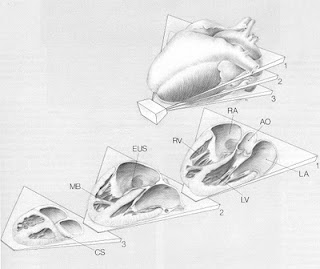
Echo - Basic Views

Figures from Echocardiography in Pediatric Heart Disease (Snider, Serwer, Ritter. 2nd Ed. Pub. Mosby 1997))

Link to a hand-out of standard views (?Mayo Clinic Course)

Standard Echo Windows


1a. Parasternal Long Axis Views


1b. Parasternal Short Axis Views


2. Apical 4-Chamber Views


3a. Subcostal Coronal Views (Long Axis)
\


3b. Subcostal Saggital Views (Short Axis)


4a. Suprasternal Views ("Long Axis")


4b. Suprasternal Views ("Short Axis")


5. Additional Views:
   a. "Crab" View (for pulmonary veins)
   b. Right Parasternal View (for Right SVC, Interatrial septum - in large/adult patients)
   c. Apical 2-Chamber View / Apical 3-Chamber View


12/08/2009

ICU: Cause of abnormal oxygen saturations from cardiac lines

Gen. rule: Check catheter tip position before interpreting the value! (Always know where the tip of each catheter is!)

Elevated RA saturation:

1) Catheter tip at renal vein

2) L→R shunt (ASD, Anomalous PV return, LV-RA shunt)

3) Decreased oxygen extraction (sepsis, CO poisoning)

4) High FiO2 (Increased dissolved oxygen)

Decreased RA saturation:

1) Catheter tip in Coronary sinus

2) Low cardiac output

3) Fever

4) Anemia

Elevated PA saturation:

1) Catheter tip is wedged

2) Left to right shunting (VSD, PDA, Other shunts: A-P collaterals, AP window)

Decreased PA saturation: (Same causes as in “Decreased RA saturation”)

Decrased LA saturation:

1) R→L shunt (ASD/PFO)

2) Systemic vein – PV or LA shunt (Veno-venous collaterals)

3) Pulmonary vein desaturation (Lung disease, V-Q mismatch, Pulmonary AVM)

12/03/2009

ICU: Causes of atrial pressure changes


High LAP

High RAP

Artifact: Catheter tip, Transducer level and calibration

Artifact: Catheter tip, Transducer level and calibration

Elevated LVEDP

Elevated RVEDP

MR (Giant v wave)

TR (Giant v wave)

MS (Giant a wave)

TS (Giant a wave)

Volume overload (Hypervolemia)

Volume overload (Hypervolemia)

L→R shunt; AP collateral

LV-RA shunt

Tamponade

Tamponade

Tachyarrhythmia (JET) (Giant a wave)

Tachyarrhythmia (JET) (Giant a wave)

Low LAP

Low RAP

Artifact: Catheter tip, Transducer level and calibration

Artifact: Catheter tip, Transducer level and calibration

Volume depletion (Low Preload)

Volume depletion (Low Preload)

Gen: Coronary Artery Anomalies in d-TGA, TOF, l-TGA...

Normal coronary anatomy: (Figures from Braunwald)


Coronary Anomalies in TOF

(Preoperative angiography in infants with tetrad of Fallot. Review of 39 cases. Am J Cardiol. 1981 Jun;47(6):1279-85)

Coronary Anomalies in d-TGA
Figure from Mavroudis's book:
(Ref: Rossi MB, Ho SY, Anderson RH, et al. Ann Thorac Surg 1986;42:573)

Figures from Eugene Braunwald's Atlas (Vol XII):
(TGA & Coronary Patterns - Ursula Sauer & Adrianna C. Gittenberger-deGroot)

1. General rules (observations) about coronary arrangement in TGA:
Four rules:
(a) Three main epicardial branches exist: ("L" for LAD, "CX" for LCX and "R" for RCA)
(b) Coronaries connect exclusively to the aortic sinuses that face the pulmonary orifice
(c) Connections between ostia and branches tend to take the shortest course; and coronaries never cross each other
(d) Positional nomenclature of the aortic sinuses facing the pulmonary orifice cause confusion.
Therefore, the following nomenclature is proposed by Dr. Gittenberger-deGroot.


2. Common Coronary Patterns in d-TGA:

Patterns of Intramural Coronaries in TGA:
Proximal course of coronary arteries in TGA:
Coronary pattern incidence in different types of TGA:


Figure from Aldo Castaneda's book:

Common Coronary Artery arrangements in d-TGA

Anatomy of the coronary arteries in TGA and methods for their transfer in anatomic correction.
(Yacoub, MH. & Radley-Smith, R. Thorax 1978;33:418-424)
(Figure is a view from front of the patient - observer facing the patient).
Total number of patients in the report = 18
a: (n=11) "Normal for TGA" pattern. Origins are at the center of the sinus.
b: (n=2) Single left coronary (Origin is closer to a commissure than in center of the sinus). LCA travels between great arteries
c: (n=1) Coronaries originate from very close to the commissures
d: (n=3) RCA gives off LCx. LAD alone comes off the left posterior sinus
e: (n=1) LCx has separate origin from right posterior sinus; RCA and LAD have a common origin...I believe that either description or the figure has an error in "e".

Figure from Kirklin/Barratt-Boyes Cardiac Surgery:
(Quaegebeur JM. The arterial switch operation. Rationale, results and perspectives. Thesis; Leiden University, The Netherlands; 1986) & (Quaegebeur JM, et al. J Thorac Cardiovasc Surg 1986;92:361)
(Table from Kirklin JW, et al. Circ 1992;86:1501)


Laid-back view to image coronary anatomy in d-TGA
Wernovsky G & Sanders SP. Coronary artery anatomy and transposition of the great arteries. Coronary artery disease 1993;4:148-157
(Original publication: Mandell et al. Am J Cardiol 1990; 65:1379-1383)


Coronary artery anatomy in l-TGA:
Ref: Sequential diagnosis of coronary arterial anatomy in congenitally corrected transposition of great arteries. Ing-Sh Chiu et al. Ann Thorac Surg 2003;75:422-9.
This is an extensive paper. Will review this "soon".

11/23/2009

Quantitative evaluation of AR by echocardiography (Excerpts from Snider, 2nd ed. p.180)


Since this is less common in children, less information is available in pediatric patients.

Three methods - Assessment of AR severity

1. LV size & function
- LVEDD, LVESD, LVEDV, LVESV, FS & EF
- LV Mass Mass/Vol. Ratio

Mass/Vol. Ratio: (Li et al. Am Soc Echo 7:S26, 1994)
Pure AS = 1.9 ± 0.7
AS & AR = 1.4 ± 0.4
Normal = 1.18 ± 0.3

2. Indirect Doppler indicators
- CW of AR jet for Deceleration rate & Timing of deceleration.
- PW of Aortic flow. (DTAo. and DAAo.) VTI of Forward flow / Reverse flow

3. Direct measurements by color Doppler
- AR jet by color (Jet & LVOT width)
- Measurement of RV, RF, & EROA.

General comments:
- Children with AS & AR developed symptoms and EKG changes earlier than those with AS only.

- Symptoms and EKG changes were present in all children with Mass/Vol. Ratio > 2.1 in AS and >1.4 in AS with AR. EKG changes help to identify children at increased risk of developing subendocardial ischemia.


Severity of AR by Doppler methods (All of this data is from adult studies. Preferable to not use this in infants with faster heart rate):

1. VTI Reverse / Forward flow in Ao
(Applies to both DTAo & DAAo by PW)
Mild - 8.9 ± 2.9 (1+)
Moderate - 23.6 ± 4.2 (2+)
Severe - 35.7 ± 5.9 (3+)
50.2 ± 6.5 (4+)

2. Deceleration slope
Mild - < 3 m/s2

3. Pressure half-time
Mild: > 400 ms
Severe: < 400 ms (=40% Regurgitant Fraction)

4. AR jet width / LVOT width
Mild - 19%
Moderate - 30%
Severe - 56% (3+)
80% (4+)


None of the following 3 are of any predictive value.
AR jet by color Doppler:
1) Length
2) Width
3) Area

Width of the jet / Width of LVOT from Parasternal long and short axis views (ref: Perry et al. JACC 9:952, 1987)

Area of jet / Area of LVOT in parasternal short axis
Limitations: The jet is not always circular, widens significantly after the orifice., especially of the gradient was high.

Direct measurements RV, RF and EROA:

By PW method:
Flow = CSA ´ VTI
RV = FlowAoV - FlowPV
RF = RV / FlowAoV

Shown to be accurate in predicting RV and RF.
(Ref: JACC 7: 1273, 1986, Circ 87:841, 1993 and JACC 23:443, 1993.)

By 2D and PW Doppler:
Forward SV = LVEDV - LVSDV
C.O. CSA ´ VTI (via MV or PV)
RV = Forward SV - C.O.
EROA = RV / VTI of Regurgitant jet by CW.
EROA > 25-30 mm2 correlates with severe AR in surgry.

By color Doppler (PISA) technique:
EROA = Regurgitant flow / Regurgitant velocity = 2p2 ´ VAL /Vo.
Regurgitant SV (RV) = EROA ´ VTI by CW.

11/17/2009

Conduction System - Normal Heart vs. AVSD (One aspect of it)

Images from Kirklin/Barratt-Boyes Cardiac Surgery 3rd edition (2003)

AVSD (p 813)
Normal Heart (p 15)


Conduction system in VSDs:
Figure below shows the AV node and His bundle relationship to membranous VSD and inlet-muscular VSD. Note: Inlet-muscular VSD is different from inlet-VSD in AVSD. The latter is shown in the first figure above.
(From Anderson RH, Wilcox BR. J Cardiac Surg. 1992;7:17-34)


11/01/2009

Thromboelastogram (TEG) - Result interpretation

TEG result parameters:
R value – Measure of coagulation time from start to initial fibrin formation.
Prolonged when there is coagulation factor deficiency, anticoagulation, severe thrombocytopenia or hypofibrinogenemia

K value: Represents clot kinetics – measuring time taken for a certain level of clot strength is reached i.e. width of the clot reaches 20 mm.
Prolonged when there is coagulation factor deficiency, hypofibrinogenemia, thrombocytopenia or thrombocytopathy.

Alpha angle: is the angle between midline and a line tangential to the developing “body” of TEG trace. Represents clot kinetics of clot build up and cross-linking.
This is increased in hypercoagulable states and decreaed in thrombocytopenia or hypofibrinogenemia.

MA: Maximum amplitude is the maximum width of the “body” of TEG trace. Represents ultimate clot strength.
Reflects platelet number and function & interaction of platelet with fibrin.
Increased in hypercoagulable states.
Decreased in thrombocytopenia, thrombocytopathy and hypofibrinogenemia.

Lysis: LY30 and LY60 – Clot lysis at 30 min and 60 min after MA.
Expressed as % of amplitude of TEG trace at 30 and 60 min in comparison to MA.
Increased in states of fibrinolysis.

Platelet function testing:
Sonoclot - an alternative for TEG. Uses ultrasonic vibration to stimulate clot formation.

VerifyNow (Accumetrics, San Diego, CA)
Clot Signature Analyzer (CSA, Xylum, Scarsdale, NY) – currently, not approved by FDA
Platelet function analyzer, PFA-100 (Dade Behring, Miami, FL)
PlateletWorks (Helena Laboratories, Beaumont, TX)

(Excerpts from Cardiopulmonary bypass Edited by Sunit Ghosh, Florian Falter and David Cook. 1st edition. Cambridge University Press, New York).

Another reference:
Vig, S. et al. Thromboelastography: a reliable test? (Blood, Coagulation and Fibrinolysis 2001;12:555-61)
Storage of sample over 90 min, showed an instability for 30 min. But, after those 30 minutes, the results were reproducible. Therefore, TEG requires a formal operating procedures established for each institution to be consistent.

10/31/2009

DORV-Adequacy of distance between TV and PV for an intracardiac baffle vs. Rastelli


Figures from Aldo Castaneda's book.

Separation between TV and PV should at least the diameter of AoV. Otherwise, SubAS within the baffle will result either at surgery or later.
(DORV-"Normally-related" Great Arteries)


10/24/2009

Neonatal Ebstein's Management - Annotation

How I Manage Neonatal Ebstein's Anomaly. Bove et al. (Semin Thorac Cardiovasc Surg Pediatr Card Surg Ann 2009;12:63-65)

Algorithm:
Image

U Mich Newborn Experience:
1988 - 2008 (20 yrs).
n=40 consecutive pts.
No intervention - 16
Neonatal intervention - 24

Mean age at surgery 6 days (1-7 days)
Mean weight 3.2 kg (2.5 - 4.1 kg)

24 surgeries:
TV closure - 11
Shunt only - 9 > 2 TV closure (one 2 days after & another during Glenn)
TV repair 4

Overall, 6 hospital deaths - 3 in TV closure group, 3 in TV repair group.

18 early survivors - 4 late deaths in 7.2 yrs mean f-up.

14 late survivors - 7 have had Fontan.

Outcome by surgery:
1) Shunt only (n=9)
All survived hospital discharge.
1 needed ECMO, had TV closure 2 days later.
2 - Fontan
1 - late TV repair & RV-PA conduit
1 - 1.5 ventricle repair
1 - TV closure at the time of Glenn.
2 - late deaths (1 died after Glenn due to hypoxia and low cardiac output and 1 died at Fontan from ventricular dysfunction).
2 - lost to f-up.

2) TV repair (n=4)
3 hospital deaths, 1 survivor is doing well at 12.5 yrs.

3) TV closure (n=11)
3 hospital deaths.
1 late death at 3 months (sudden death; unknown cause)
Remaining 7 had Fontan.

Overall survival:
All neonatal surgeries:
66.7% at 1 yr
62.2% at 5, 10 yrs
51.9% at 15 yrs

TV closure:
63.6% at 1, 5, 10 yrs
47.7% at 15 yrs

Shunt only:
88.9% at 1 yr
76.2% at 5, 10 yrs

TV repair:
25% at 1, 5, 10, yrs.

Comments: Review article. Not randomized. No clear indication as to equal disease severity of Ebsteins who underwent different interventions. Therefore, this should not be viewed as comparison of surgeries for the same severity of disease. Each patient would have been evaluated and the surgical option applied depending on disease features and institutional experience.


10/08/2009

Erythromycin

Erythromycin is used as a prokinetic for GI mobility. This is used in some postoperative cardiac patients when Metoclopromide is deemed to be not useful. What is the effect of Erythromycin on the heart? Why is it risky to use?

IV vs. Oral Propranolol

IV dose of Propranolol is much lower than Oral dose. What are the respective doses? Why does the dose differ between the two routes. Note: GI absorption problem is not the answer.

10/02/2009

ICU: Cardiopulmonary Interaction - Spontaneous breathing vs. Positive Pressure Ventilation

Optimum PEEP in adult patients with ARDS:
(Figure from ICU book - Paul Marino 2nd ed)


PEEP vs. Cardiac output
[Ref: Fessler, HE. Effects of CPAP on venous return. J Sleep Res 1995;4 (Suppl 1):44-49]
Beware of this first figure...this is a study in Sleep Apnea patients...it is an important question to ask whether this is entirely applicable to our cardiac ICU babies/infants!

Useful reference: The use, abuse and mystique of positive end-expiratory pressure. Am Rev Respir Dis 1988;138:475-8.

Anesthetized Dog:
(Following figures are from AC Chang's textbook - Pediatric Cardiac Intensive Care)

LV afterload


Vertical Dotted Lines enclose Inspiration